
In my previous article, I discussed why SOPs become important as businesses grow. In this article, I want to share how I structured the invoicing process in an IT services company that was moving from manual operations towards automation.
Since it was a startup, the team was initially small, volumes were manageable, and coordination was mostly informal. Invoicing was therefore handled manually. However, as the business expanded – with more clients, more consultants, and increasing billing variations – the same system began causing delays and confusion.
At the same time, automation was being planned, and inputs were being gathered from the operations team to build a customized internal system on Remote Desktop. For that to work effectively, the invoicing process first had to be clearly mapped and documented.
So, I mapped the invoicing process exactly as it functioned in the company and formalized it step by step.
Invoicing Process Workflow (SOP Structure)
The flowchart below outlines how the invoicing workflow was designed to cover the entire process – from onboarding to compliance – rather than focusing only on invoice preparation.
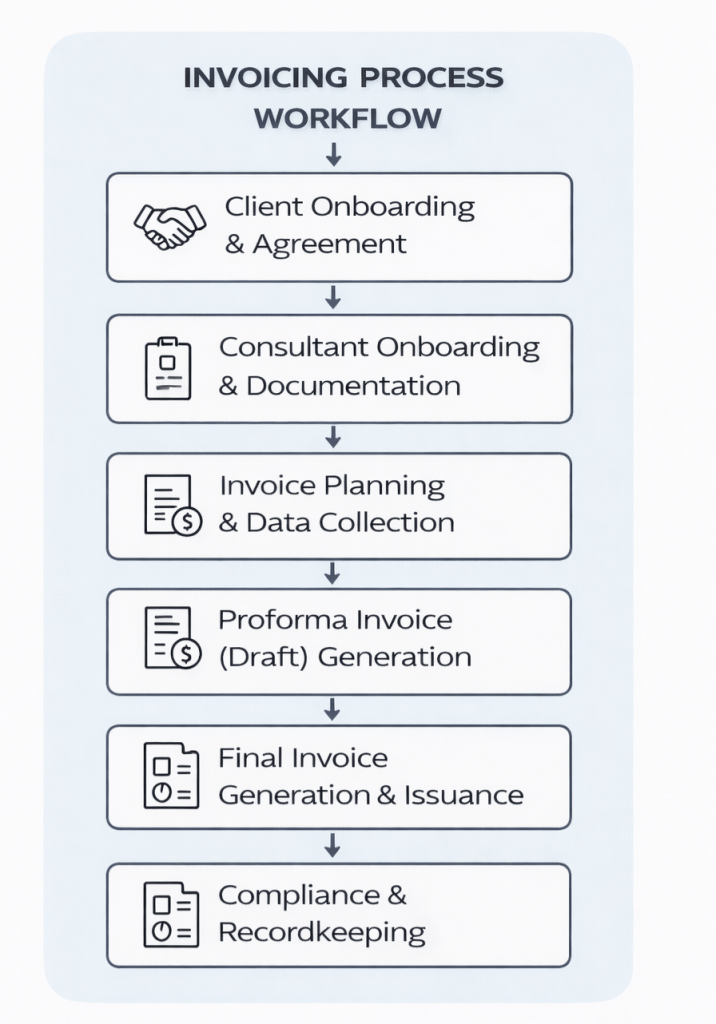
The detailed steps for each stage are described below.
1. Client Onboarding & Agreement
Objective: Ensure billing terms and statutory details are defined before invoicing begins.
- Sign a formal agreement (MSA/SOW) with clearly defined billing terms
- Creation of client master in internal system (GST, PAN, address, tax configuration)
- Storage of agreement and statutory data in designated shared folder
2. Consultant Onboarding & Documentation
Objective: Ensure complete documentation before activation for billing.
- Collection of identity and statutory documents (PAN, Aadhaar, GST if applicable)
- Bank account details for payments
- Signed agreement / offer letter
- Creation of consultant master in internal records
- Mandatory completion before billing eligibility
Updated upon onboarding of each new consultant
3. Monthly Invoice Planning & Data Collection
Objective: Validate billing inputs before invoice preparation.
- Monthly billing cycle initiated
- Client-side inputs:
- PO / SOW confirmation
- Rate card validation (regular & overtime)
- Applicable GST structure
- Withholding tax (TDS) and other agreed deductions
- Consultant-side inputs:
- Approved timesheets
- Overtime approvals
- Reimbursement documentation
- Consolidation of all inputs before defined monthly cut-off (e.g., 5th)
- Maintenance of issuance and tracking logs
4. Proforma Invoice (Draft) Generation
Objective: Reduce errors before final invoice issuance.
- Generation of draft invoice using standard template
- Validation of billing period, service description, and tax computation
- Attachment of supporting documents
- Client review and approval before finalisation
5. Final Invoice Generation & Issuance
Objective: Formal invoice issuance and tracking.
- Final invoice generated post approval
- Internal review where required
- Dispatch via email or client billing portal
- Logging of dispatch date, due date, and contact details
6. Payment Tracking & Follow-up
Objective: Ensure timely collection and reconciliation.
- Monitoring of agreed payment terms
- Follow-up reminders for overdue invoices
- Reconciliation of receipts
Updating of tracking system
7. Compliance & Recordkeeping
Objective: Maintain audit-ready documentation.
- Archival of invoices and supporting documents in structured cloud folders
- Maintenance of GST records and invoice registers
- Submission of statutory documents (ESI, EPF, etc.) where required
- Sharing of required payroll/compliance documentation with client
One key principle followed throughout was: Invoicing begins at onboarding, not at billing.
Standardizing the Folder Structure
Along with defining the process flow, it was equally important to standardize how documents were stored. A folder structure was created so that every input had a clear place for storage and reference.
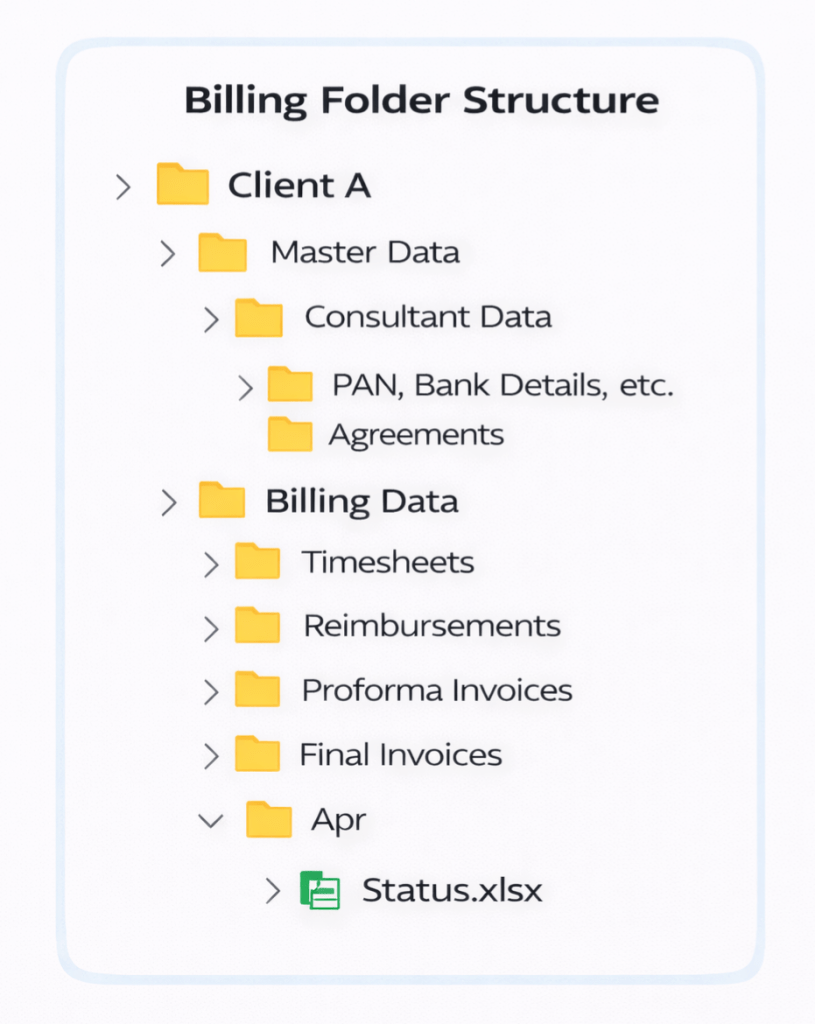
The folder hierarchy broadly covered:
- Client Master Data
- Consultant Documentation
- Billing Data (Timesheets, Reimbursements, Proforma, Final Invoices)
- Month-wise status tracking
This created a central reference point for finance, HR, and founders, making it easier to manage billing, consultant payments, TDS and compliance requirements, audits, and overall coordination.
Why This Structure Was Important
This workflow was built around how the company actually operated. Every business will have its own variations, and the process should reflect that reality. The reason I am sharing this example is not to suggest that one structure fits all, but to highlight how important it is to define processes clearly before attempting automation.
In this case, once the invoicing flow was properly structured, building the system became much simpler because the software could follow a clearly defined process instead of informal practices.
A Key Takeaway
This experience reinforced for me that strong processes make automation meaningful. When the process is clear, automation brings consistency, reduces dependency on individuals, and improves control over revenue and cash flow.
In finance, that clarity translates into discipline – more predictable billing, better compliance, smoother coordination, and clearer financial visibility as the business grows.